| Memo Report No. TSCEP5E-1908
15 June 1945 |
| I Introduction
Flight tests were conducted at Wright Field, Dayton, Ohio, on the P-51D-15NA airplane, AAF No. 44-15342. The tests were requested by the Chief, Technical Data Laboratory, Engineering Division, and flown by Major E. W. Leach and Captain D. Gentile in order to check data given in Flight Operating Instruction, T. O. AN-60JE-1. II Summary Fuel consumption and speed data listed in the flight operation instruction chart have been spot checked by duplicating in the test program some of the power settings shown in the T. O. By comparing the results obtained with the T. O. figures, a quick estimate of the validity of the T. O. may be made. High speed and climb performance have been obtained on this airplane at a take-off gross weight of 9760 pounds. Performance was obtained up to an altitude of 35,000 feet in increments of 5000 feet in a clean configuration. The clean configuration included one external bomb rack on each wing. Additional configurations were flown at 5000 and 15,000 feet including two 110 gallon tanks, two 500 pound bombs, and two 250 pound bombs. The principal results are as follows: A. Clean Configuration (with bomb racks). |
| 1. | Maximum speed at critical altitudes | ||
| High Blower | |||
| War Emergency power (3000 RPM and 67") 26000' | 442 MPH | ||
| Military power (3000 RPM and 61") 28000' | 439 MPH | ||
| Normal Rated power (2700 RPM and 46") 29400' | 420 MPH | ||
| Low Blower | |||
| War Emergency power (3000 RPM and 67") 10000' | 417 MPH | ||
| Military power (3000 RPM and 61") 13200' | 413 MPH | ||
| Normal Rated power (2700 RPM and 46") 16200' | 387 MPH | ||
| 2. | Maximum speed at sea level | ||
| War Emergency power (3000 RPM and 67") | 375 MPH | ||
| Military power (3000 RPM and 61") | 364 MPH | ||
| Normal Rated power (2700 RPM and 46") | 323 MPH | ||
| 3. | Rate of climb at critical altitude. | ||
| War Emergency power (3000 RPM and 67") high blower (19,000') | 3200 ft/min. | ||
| War Emergency power (3000 RPM and 67") low blower (4,800') | 3600 ft/min. | ||
| 4. | Time to climb to service ceiling, war emergency power (3000 RPM and 67") (41600') | 28 minutes. |
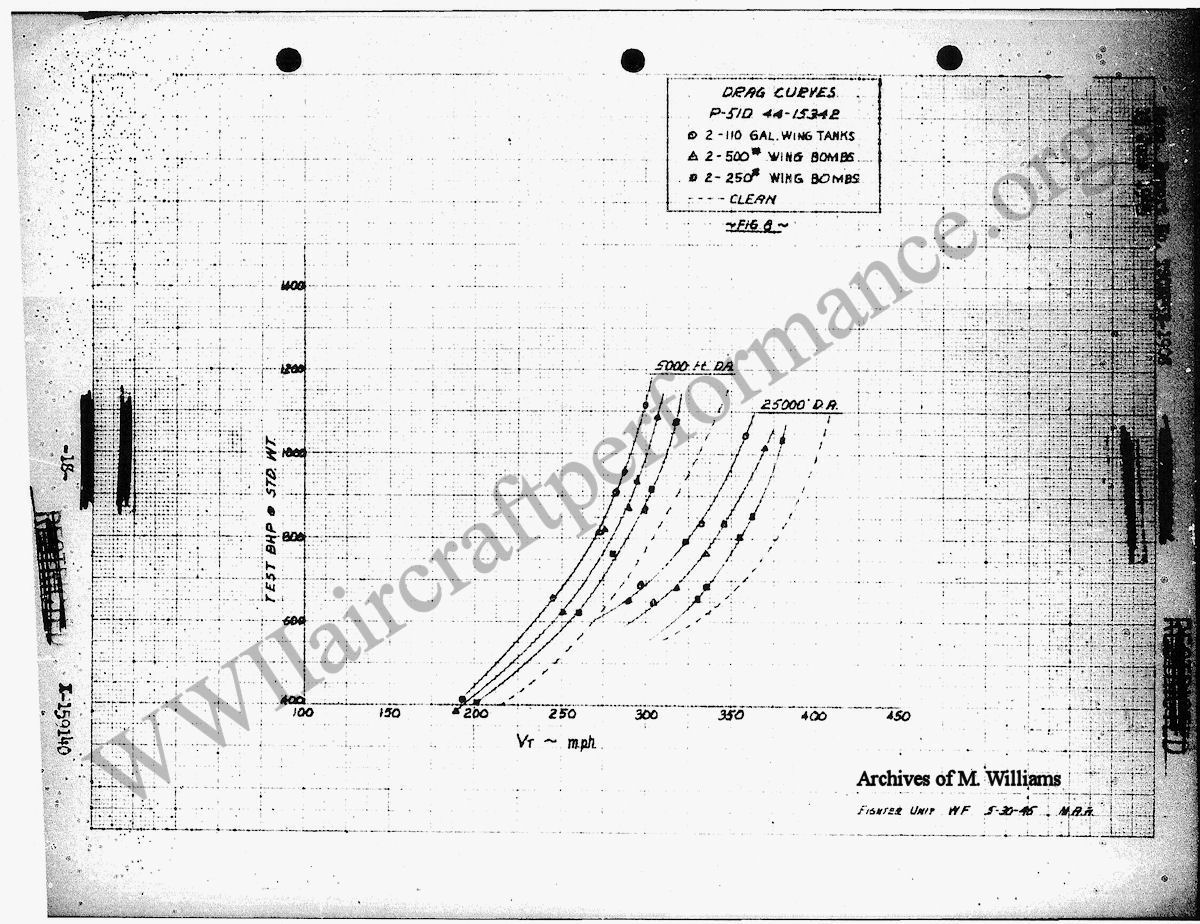
| B. True speed loss, MPH from clean configuration due to external load items (2700 RPM and 46"). |
| 2-110 Gal. Tanks | 2-500 Lb. Bombs | 2-250 Lb. Bombs |
| 5000 ft. 45 | 36 | 25 |
| 25000 ft. 47 | 33 | 23 |
| III Condition of Airplane Relative to Test
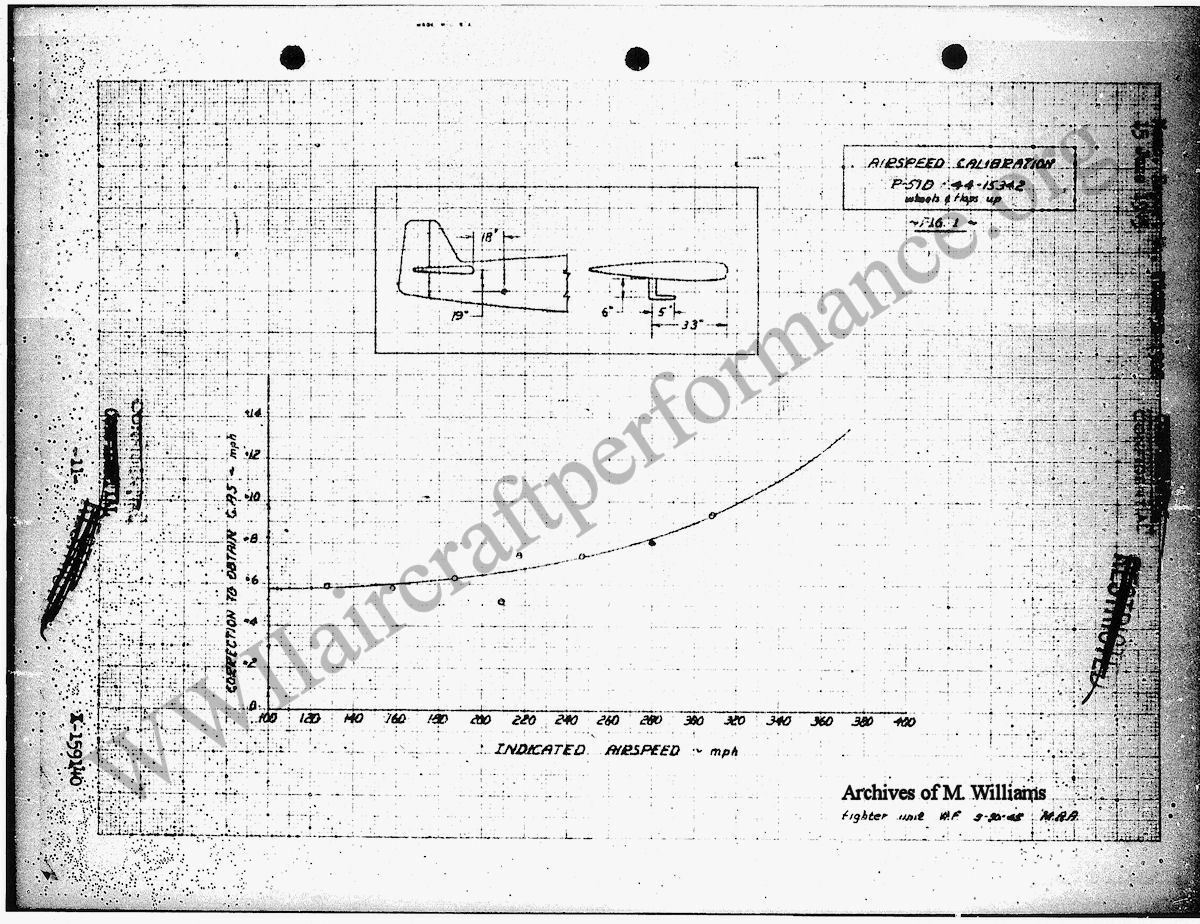
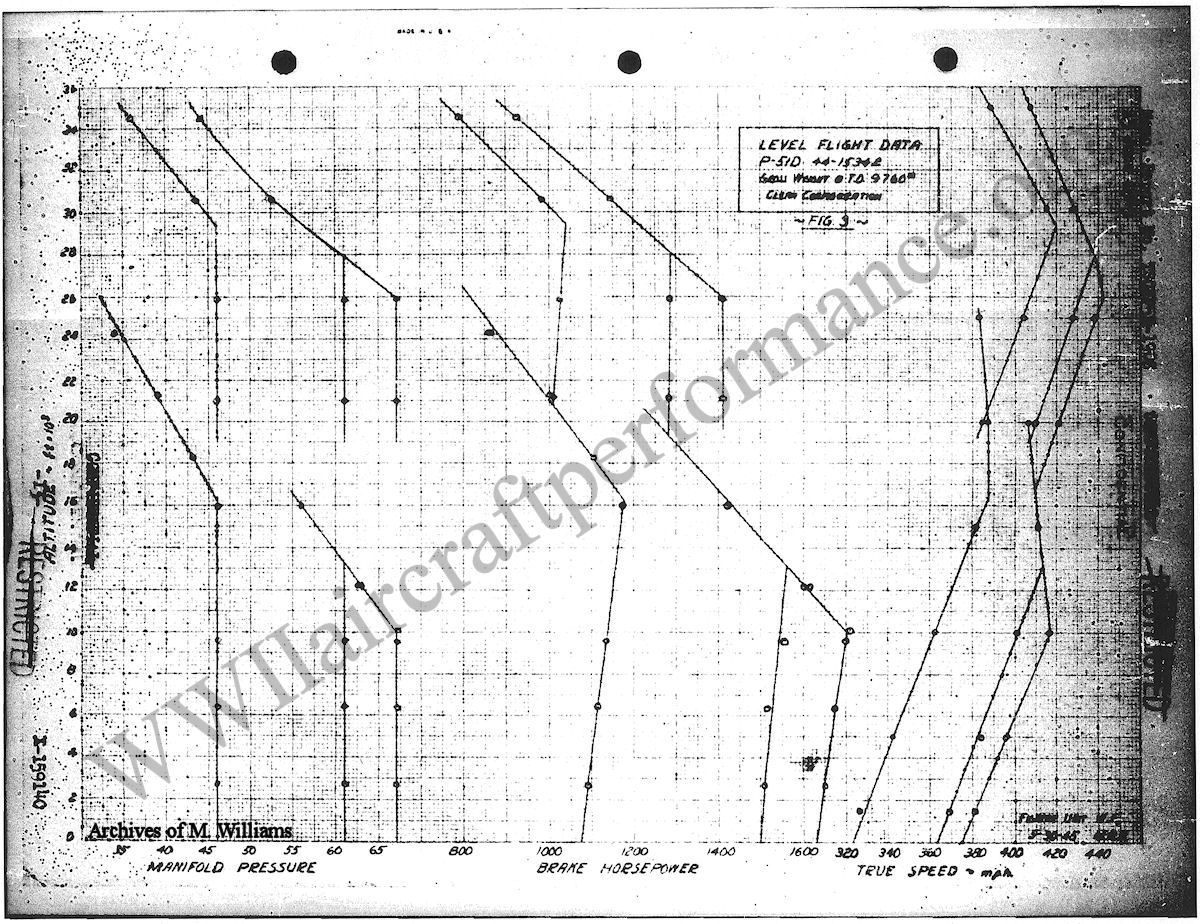
With exception of the external load configurations all flights were made at a combat take-off weight of 9760 pounds. This includes full ammunition, full oil of 21 gallons, full wing gas load of 184 gallons and 25 gallons of gas in the fuselage tank which has a capacity of 85 gallons. The center of gravity at this loading was 27.63% MAC gear down and 27.89% MAC gear up. A photo observer was installed to record data during the climbs. Level flight data was observed by the pilot. The airplane is powered with a 1650-7 engine equipped with a two stage two speed supercharger and a Bendix PD-18-A1 injection type carburetor. The supercharger speed may be controlled either manually, or automatically by an aneroid type pressure switch. This aneroid control will change the blower speed from low to high at apporximately 16,000 feet, the exact altitude varying with the amount of ram in the carburetor intake. The supercharger differs from most two stage installations in that both stages compress a fuel air mixture. This airplane is equipped with a single position carburetor having three setting: "idle cut off", "run", and "emergency full rich". The carburetor is automatic and the normal operating position is "run". The engine turns a Ham. Std. Hydromatic constant speed four bladed propeller, Dwg. No. K6523A-24. All power figures are based on power curves prepared by the Wright Field Power Plant Laboratory on December 3, 1943 according to Eng. Spec. AC-1070 and AC-1170. IV Performance Data A. Airspeed Indicator and Altimeter Calibration The location of the flush static airspeed system and the airspeed position correction is shown in Figure 1, Appendix A. B. High Speed Data 1. Curves of speed vs. altitude are given in Figure 3, Appendix A, for a take-off gross weight of 9760 pounds. 2. High speed in level flight at 3000 RPM and 67" Hg (War Emergency Power) is as follows for a mixture setting at "run" and coolant flaps in automatic at a take-off gross weight of 9760 pounds. |
| ALT. FT. | TRUE SPEED MPH. | MAN. PRESS. "Hg | BHP FROM CHART | BLOWER | THROTTLE SETTING | APPROX. GROSS WT. AT ALT. |
| 0 | 375 | 67 | 1630 | low | part | 9700 |
| 5000 | 396 | 67 | 1667 | low | part | 9680 |
| *10000 | 417 | 67 | 1700 | low | W. O. | 9660 |
| 15000 | 411 | 57.7 | 1480 | low | W. O. | 9640 |
| 20000 | 421 | 67 | 1410 | high | part | 9620 |
| 25000 | 438 | 67 | 1410 | high | part | 9600 |
| **26000 | 442 | 67 | 1410 | high | W. O. | 9590 |
| 30000 | 429 | 54.5 | 1180 | high | W. O. | 9570 |
| 35000 | 407 | 43 | 900 | high | W. O. | 9530 |
| *Low blower critical altitude
**High blower critical altitude 3. High speeds in level flight at 3000 RPM and 61" Hg (Military Power) mixture "run", coolant flap in automatic at a take-off gross weight of 9760 pounds is as follows: |
| ALT. FT. | TRUE SPEED MPH. | MAN. PRESS. "Hg | BHP FROM CHART | BLOWER | THROTTLE SETTING | APPROX. GROSS WT. AT ALT. |
| 0 | 363 | 61 | 1500 | low | part | 9700 |
| 5000 | 382 | 61 | 1520 | low | part | 9680 |
| 10000 | 401 | 61 | 1545 | low | part | 9660 |
| *13200 | 413 | 61 | 1560 | low | W. O. | 9650 |
| 15000 | 411 | 57.8 | 1475 | low | W. O. | 9640 |
| 20000 | 410 | 61 | 1280 | high | part | 9620 |
| 25000 | 428 | 61 | 1285 | high | part | 9600 |
| **28000 | 438 | 61 | 1288 | high | W. O. | 9580 |
| 30000 | 429 | 54.5 | 1180 | high | W. O. | 9570 |
| 35000 | 407 | 43 | 900 | high | W. O. | 9530 |
| *Low blower critical altitude
**High blower critical altitude 4. High speed in level flight at 2700 RPM (Normal Rated Power) mixture "run", coolant flap in automatic at a take-off gross weight of 9760 pounds is as follows: |
| ALT. FT. | TRUE SPEED MPH. | MAN. PRESS. "Hg | BHP FROM CHART | BLOWER | THROTTLE SETTING | APPROX. GROSS WT. AT ALT. |
| 0 | 323 | 46 | 1075 | low | part | 9700 |
| 5000 | 342 | 46 | 1105 | low | part | 9680 |
| 10000 | 362 | 46 | 1140 | low | part | 9660 |
| 15000 | 382 | 46 | 1170 | low | part | 9640 |
| *16200 | 387 | 46 | 1175 | low | W. O. | 9640 |
| 20000 | 387 | 40.5 | 1037 | low | W. O. | 9620 |
| 20000 | 384 | 46 | 1005 | high | part | 9620 |
| 25000 | 404 | 46 | 1025 | high | part | 9600 |
| **29400 | 420 | 46 | 1040 | high | W. O. | 9576 |
| 30000 | 416 | 44.7 | 1010 | high | W. O. | 9570 |
| 35000 | 388 | 35 | 765 | high | W. O. | 9530 |
| *Low blower critical altitude
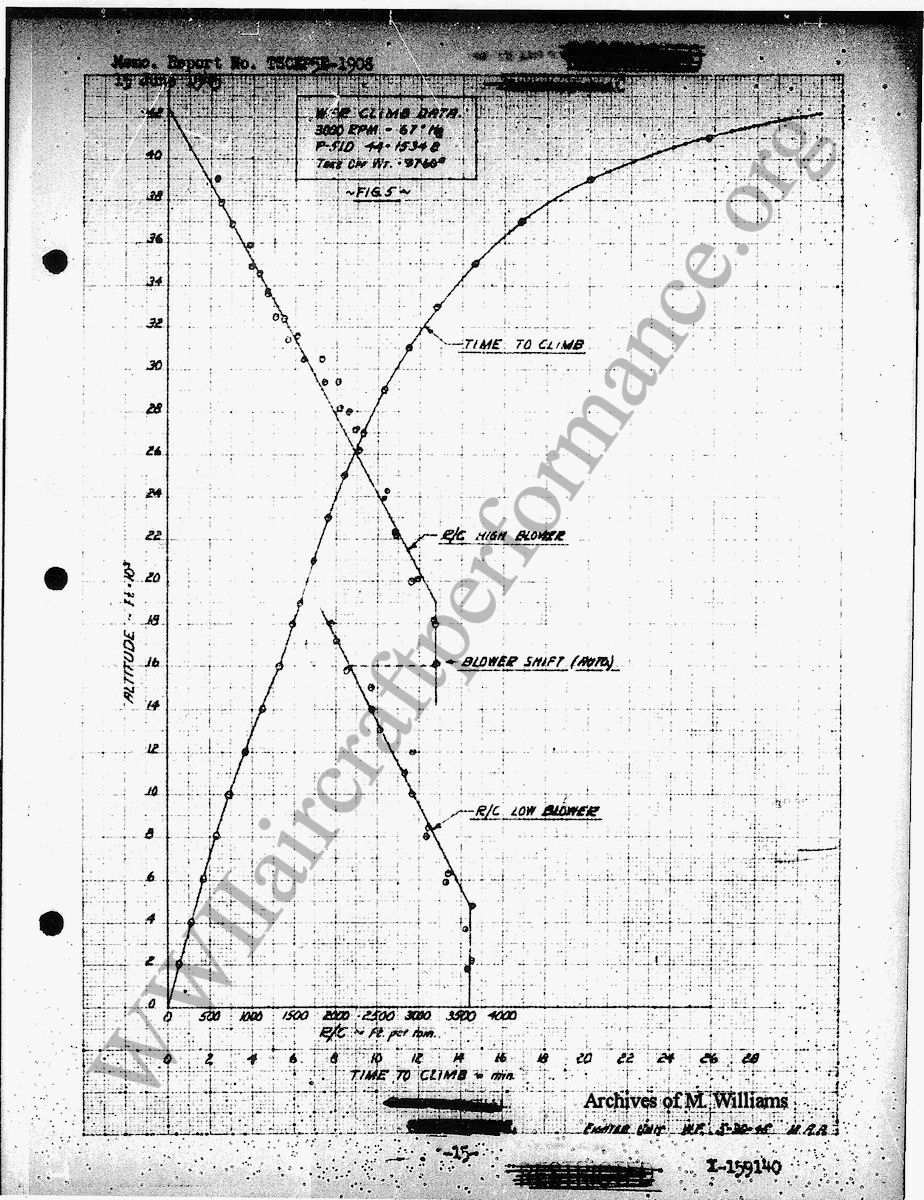
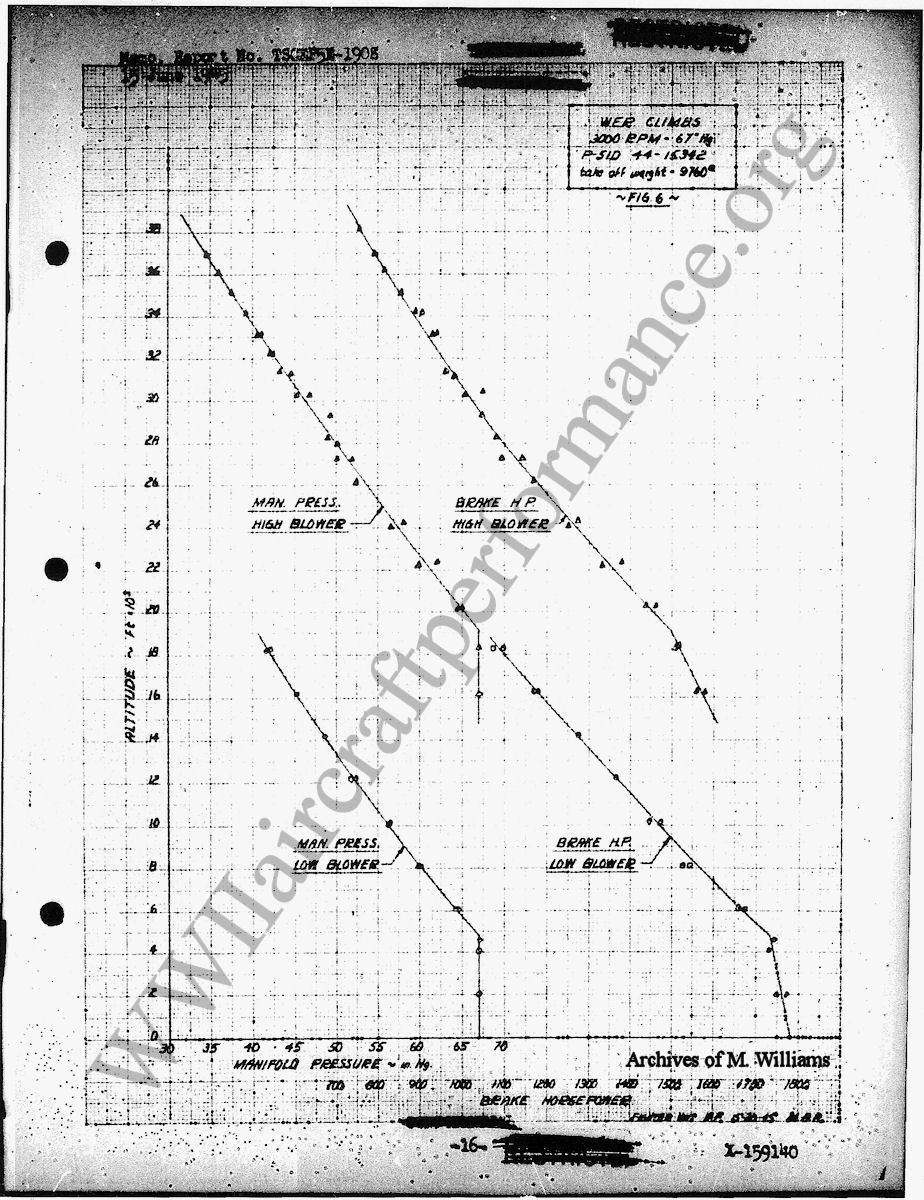
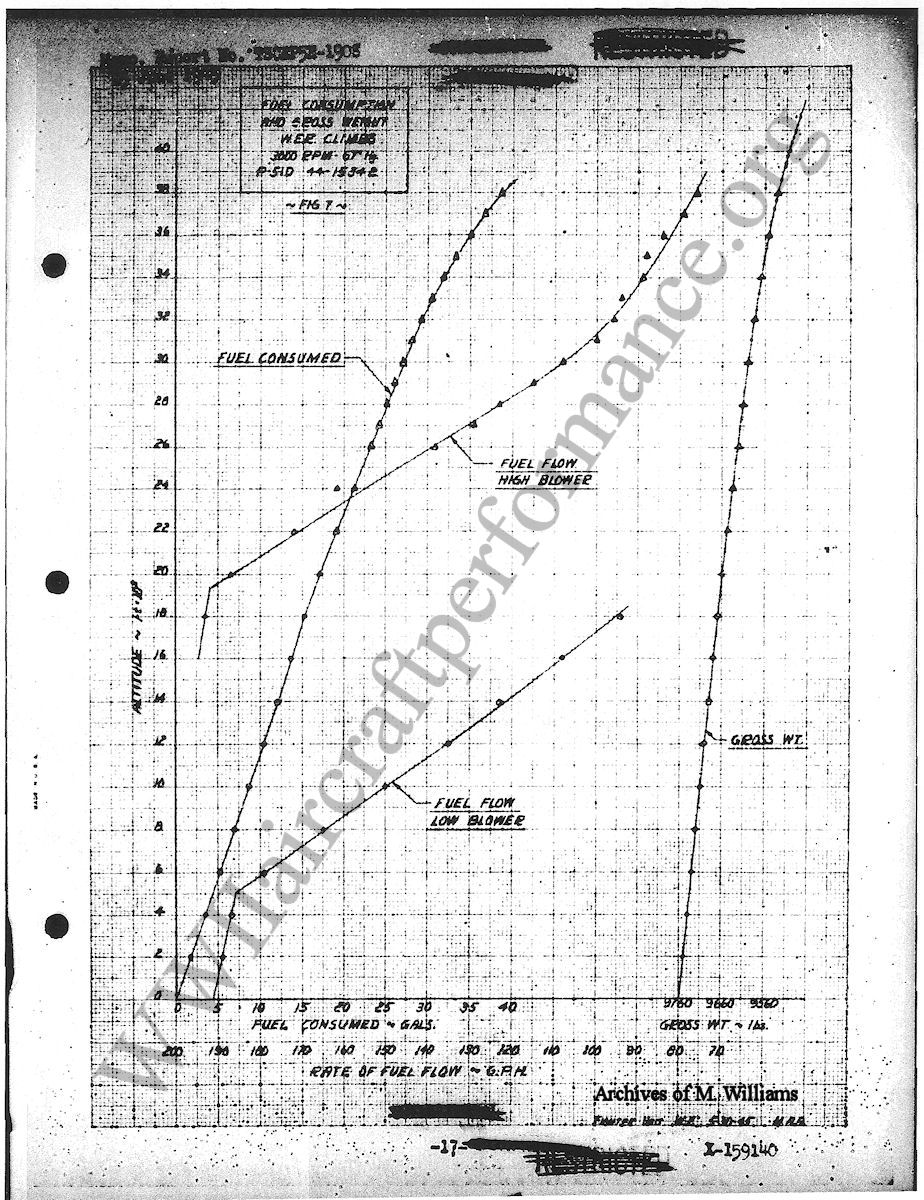
**High blower critical altitude C. Climb Data Curves indicating war emergency power climb performance (3000 RPM and 67" Hg) are given in Figure 5, 6, and 7, Appendix A. Four check climbs were flown, two in low blower from the ground up to 18000 feet and two in high blower from 17,000 feet to service ceiling. Tests were flown with coolant flaps in automatic and mixture set in "run" at a take-off gross weight of 9760 pounds. Data is as follows: |
| ALT. FT. | MAN. PRESS. "Hg | BHP FROM CHART | THROTTLE POSITION | BLOWER | STD. R/C FT/MIN | TIME TO CLIMB | FUEL * CONSUMED GAL. | AIRPLANE WEIGHT (LBS) | IAS ** MPH |
| 0 | 67 | 1780 | part | low | 3600 | 0 | 0 | 9760 | 165 |
| 4800 | 67 | 1730 | W. O. | low | 3600 | 1.3 | 4.2 | 9735 | 165 |
| 5000 | 66.5 | 1720 | W. O. | low | 3575 | 1.4 | 4.4 | 9733 | 165 |
| 10000 | 56.3 | 1470 | W. O. | low | 2925 | 2.9 | 8.7 | 9710 | 165 |
| 15000 | 47.2 | 1232 | W. O. | low | 2275 | 4.8 | 13.0 | 9682 | 159.5 |
| 16000 | 67 | 1580 | part | high | 3200 | 5.3 | 13.6 | 9680 | 158.5 |
| 19000 | 67 | 1500 | W. O. | high | 3200 | 6.2 | 16.3 | 9664 | 158 |
| 20000 | 65.2 | 1455 | W. O. | high | 3050 | 6.6 | 17.2 | 9660 | 158 |
| 25000 | 55.5 | 1225 | W. O. | high | 2375 | 8.4 | 22.2 | 9630 | 156.5 |
| 30000 | 46.4 | 1025 | W. O. | high | 1700 | 10.9 | 27.3 | 9600 | 151.5 |
| 35000 | 37.7 | 855 | W. O. | high | 1000 | 14.6 | 33.4 | 9560 | 146.5 |
| 40000 | 29.8 | 700 | W. O. | high | 325 | 22.2 | 44.0 | 9505 | 141.5 |
| 41600 | 27.5 | 650 | W. O. | high | 100 | 28.0 | 51 | 9480 | 141.5 |
| Absolute ceiling in high blower 42400 feet.
* No allowance shown for warm up and take-off ** Corrected for instrument error D. External Load Configurations 1. Drag curves for the external load configurations are shown in Figure 8. Flights were made at 5000 and 25000 feet for each configuration with mixture setting at "run", coolant flaps automatic and take-off gross weight at 9760 pounds plus the weight of the external items. 2. Data at 5000 Feet Altitude |
| CONFIG. | TRUE SPEED MPH. | RPM | MAN. PRESS. "Hg | BHP FROM CHART | BLOWER | THROTTLE SETTING | APPROX. GR. WT. AT ALT. | AIR MILES PER GAL. |
| 2-110 Gal. Wing Tanks | 298 | 2700 | 46 | 1096 | low | part | 11022 | 3.48 |
| " | 286 | 2500 | 43 | 941 | low | part | 11022 | 3.83 |
| " | 280 | 2500 | 41 | 887 | low | part | 11022 | 3.87 |
| " | 268 | 2200 | 40 | 790 | low | part | 11022 | 3.98 |
| " | 240 | 1900 | 37 | 637 | low | part | 11022 | 4.81 |
| " | 187 | 1600 | 30 | 389 | low | part | 11022 | 5.29 |
| 2-500 lb. Wing Bombs | 307 | 2700 | 46 | 1089 | low | part | 10700 | 3.49 |
| " | 296 | 2500 | 43 | 942 | low | part | 10700 | 3.88 |
| " | 289 | 2500 | 41 | 873 | low | part | 10700 | 3.87 |
| " | 282 | 2200 | 40 | 820 | low | part | 10700 | 4.32 |
| " | 248 | 1900 | 37 | 618 | low | part | 10700 | 4.86 |
| " | 185 | 1600 | 30 | 376 | low | part | 10700 | 5.14 |
| 2-250 Lb. Wing Bombs | 318 | 2700 | 46 | 1091 | low | part | 10159 | 3.24 |
| " | 305 | 2500 | 43 | 927 | low | part | 10159 | 3.95 |
| " | 298 | 2500 | 41 | 877 | low | part | 10159 | 3.98 |
| " | 284 | 2200 | 40 | 769 | low | part | 10159 | 4.09 |
| " | 260 | 1900 | 37 | 624 | low | part | 10159 | 4.87 |
| " | 198 | 1600 | 30 | 396 | low | part | 10159 | 5.19 |
| 3. Data at 25,000 Feet Altitude |
| CONFIG. | TRUE SPEED MPH. | RPM | MAN. PRESS. "Hg | BHP FROM CHART | BLOWER | THROTTLE SETTING | APPROX. GR. WT. AT ALT. | AIR MILES PER GAL. |
| 2-110 Gal. Wing Tanks | 357 | 2700 | 46 | 1037 | high | part | 10855 | 3.58 |
| " | 331 | 2400 | 39 | 820 | high | W.O. | 10855 | 4.49 |
| " | 321 | 2400 | 37.5 | 782 | high | part | 10855 | 4.30 |
| " | 297 | 2250 | 33.7 | 674 | high | W.O. | 10855 | 4.64 |
| " | 281 | 2250 | 32 | 631 | high | part | 10855 | 4.91 |
| 2-500 lb. Wing Bombs | 371 | 2700 | 46 | 1026 | high | part | 10546 | 4.19 |
| " | 359 | 2400 | 40.8 | 863 | high | W.O. | 10546 | 4.93 |
| " | 336 | 2400 | 37.8 | 771 | high | part | 10546 | 5.10 |
| " | 317 | 2250 | 35.7 | 685 | high | W.O. | 10546 | 5.21 |
| " | 308 | 2250 | 33 | 650 | high | part | 10546 | 5.59 |
| 2-250 Lb. Wing Bombs | 382 | 2700 | 46 | 1049 | high | part | 9976 | 4.17 |
| " | 366 | 2400 | 41.9 | 883 | high | W.O. | 9976 | 4.73 |
| " | 356 | 2400 | 39 | 811 | high | part | 9976 | 4.92 |
| " | 341 | 2250 | 37 | 711 | high | W.O. | 9976 | 5.15 |
| " | 331 | 2250 | 34 | 659 | high | part | 9976 | 5.64 |
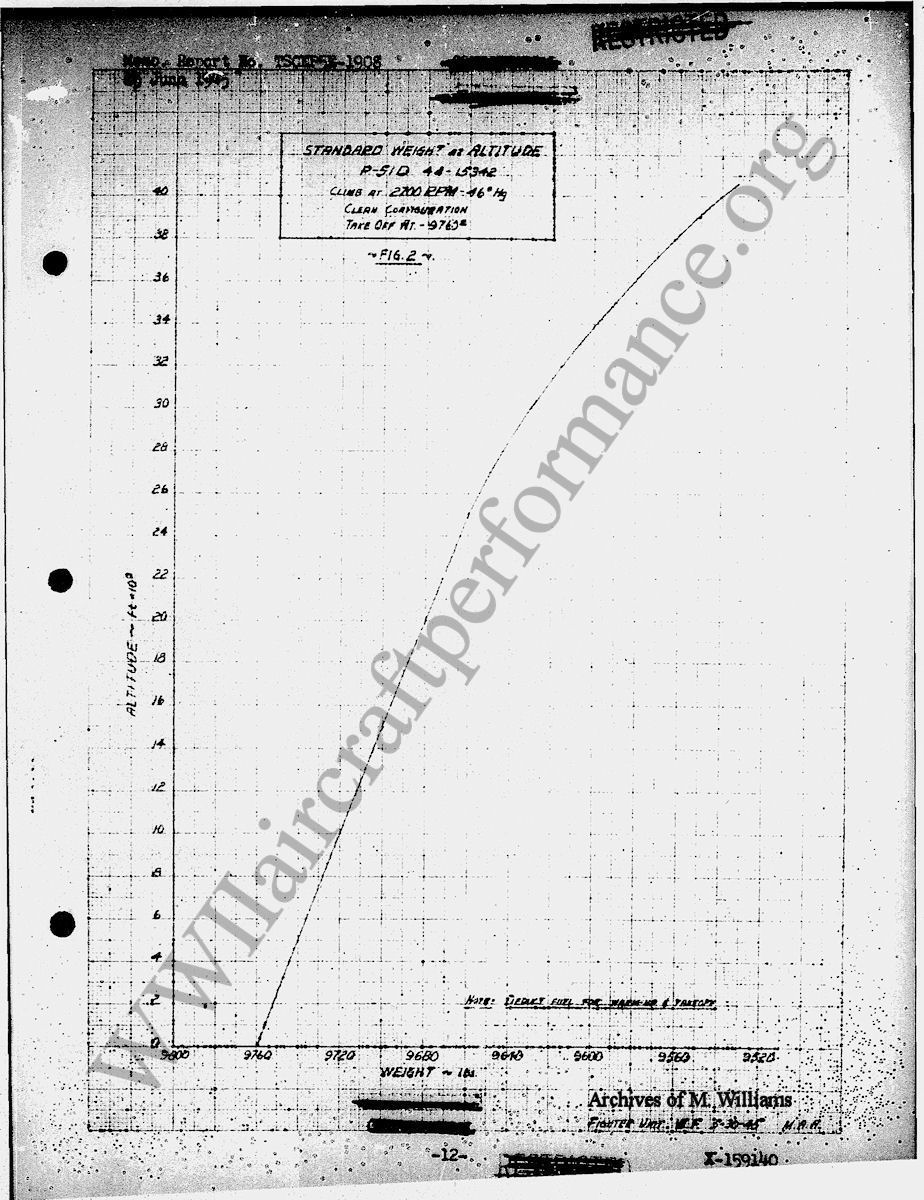
| E. Cooling Shutter Tests
All tests were flown with oil and coolant flaps automatically controlled by thermostats set to maintain a coolant temperature of 107°C and oil temperature of 70°C. All performance was therefore corrected to flap positions which would maintain these temperatures on a standard day. The effect of oil and coolant flap positions on indicated airspeed is shown in Figure 9. F. All data has been reduced to NACA standard atmospheric conditions. Performance curves are presented as Appendix to this report. A normal rated power curve (2700 RPM and 46" Hg) was flown to establish a standard weight at various altitudes. Performance data is corrected to this weight, as shown in Figure 2, less an allowance of 60 pounds of fuel for warm up and take-off. V Conclusions A table is presented in Appendix B which shows fuel consumption and speeds obtained with power settings used in this test. Where ever corresponding power settings are given in the T. O. this data is shown in parentheses. A comparison shows the difference in speeds to average approximately 3% and the difference in fuel flows to average approximately 6%. VI Recommendation None Figure 1. Airspeed Calibration
|